

Unless you have been living under a rock for the past few years, you ought to have heard of a legendary man; Jensen Huang: The leather jacket, family man, the billionaire you could almost imagining trusting, the Gabe Newell of AI hardware. Huang has painted a life revolving around his family and his company, until on this very faithful day, 8th November, it is all falling down!
Huang admitted publicly to being unfaithful to his wife; meanwhile, US intelligence officials reportedly believed the women in question shared information with Beijing. The storyline was everything a newsroom could ever want: sex, AI and China.

At which point, a suspicious reader might start to look around. Looking not too far into history. Jeff Bezos announced his divorce back in 2019, and Amazon finished that day up 0.2%. Boeing went further in 2005, removing Harry Stonecipher after an affair with another executive. Its shares finished a mere 8 cent lower.
Then there’s Jensen. Nvidia shed more than $430 billion in market value in just two trading sessions, roughly taking its valuation back to where it stood during last year’s Oktoberfest, when I was drunk and opened a long position.
FISHY!
Is it the affair? The possibility of losing the man running Nvidia? or does adding Chinese spy to a headline come with a special shareholder surchage? Or was there some deep state media manipulation going on? Lets find out systematically.
Methodology
We downloaded headlines, dates, links and daily counts from Media Cloud, screened for relevant coverage, and grouped identical headlines published on the same day. The analysis uses completed days through 10 November 2026.
We modelled background attention as an initial news burst and persistence from earlier converge via the Hawkes (1971) and Zhu (2011) construction.
Here, denotes the day being predicted and \(s\) an earlier day. is the observed number of screened headline groups, while is the model's expected count. measures that day's archive size relative to its usual size; and are the corresponding values for an earlier day. represents background coverage, estimated from the preceding 28 days. controls the initial news burst, and is its half-life in days. controls the contribution of earlier coverage, with its weight halving for each additional day of age. Finally, controls the extra variation allowed by the negative-binomial distribution. describes how widely today's possible count could fluctuate around the prediction, given earlier observations.Archive size and background attention were calculated as
We compared the recorded coverage with what the model predicted after the initial news burst. Here is the archive’s total English-language article count. Day zero marks the main burst and the first three days tells us the size of the initial burst; the following eleven days is therefore a good test for whether coverage developed as predicted. We chose the model’s settings using the other reference controversies (Stone, 1974).
Choosing the Parameters
We used three reference controversies: Bernard Looney at BP, Brian Krzanich at Intel and Steve Easterbrook at McDonald’s. To test each case, we chose the model’s settings using the other two, then examined how well those settings predicted the case left out Stone (1974).
Due to computational complexity, we used grid search for parameter fitting, searching through: burst half-lives of 0.5, 1, 2 or 4 days; earlier-coverage strengths of 0, 0.25, 0.5 or 0.75; and variation settings of 0, 0.25, 1 or 4. We preferred combinations that assigned higher probabilities to the daily counts that actually appeared, giving each controversy equal weight. The one-day decay of the earlier-coverage term was fixed in advance.
We then used all three references to select the settings for Huang.
Parameter | Value for Huang | Obtained how |
|---|---|---|
1 | Selected using the reference cases | |
0 | Selected using the reference cases | |
1 | Selected using the reference cases | |
1.2013 | Calculated from the preceding 28 days, adjusting for archive size | |
177.0666 | Fitted to Huang’s first three days, |
The archive’s typical size was 9,382 English-language articles per day. Dividing each day’s total by this number supplied . The preceding 28 days contained 32 relevant headline groups, giving .
Because the selected value of was zero, the fitted model simplified to
Results
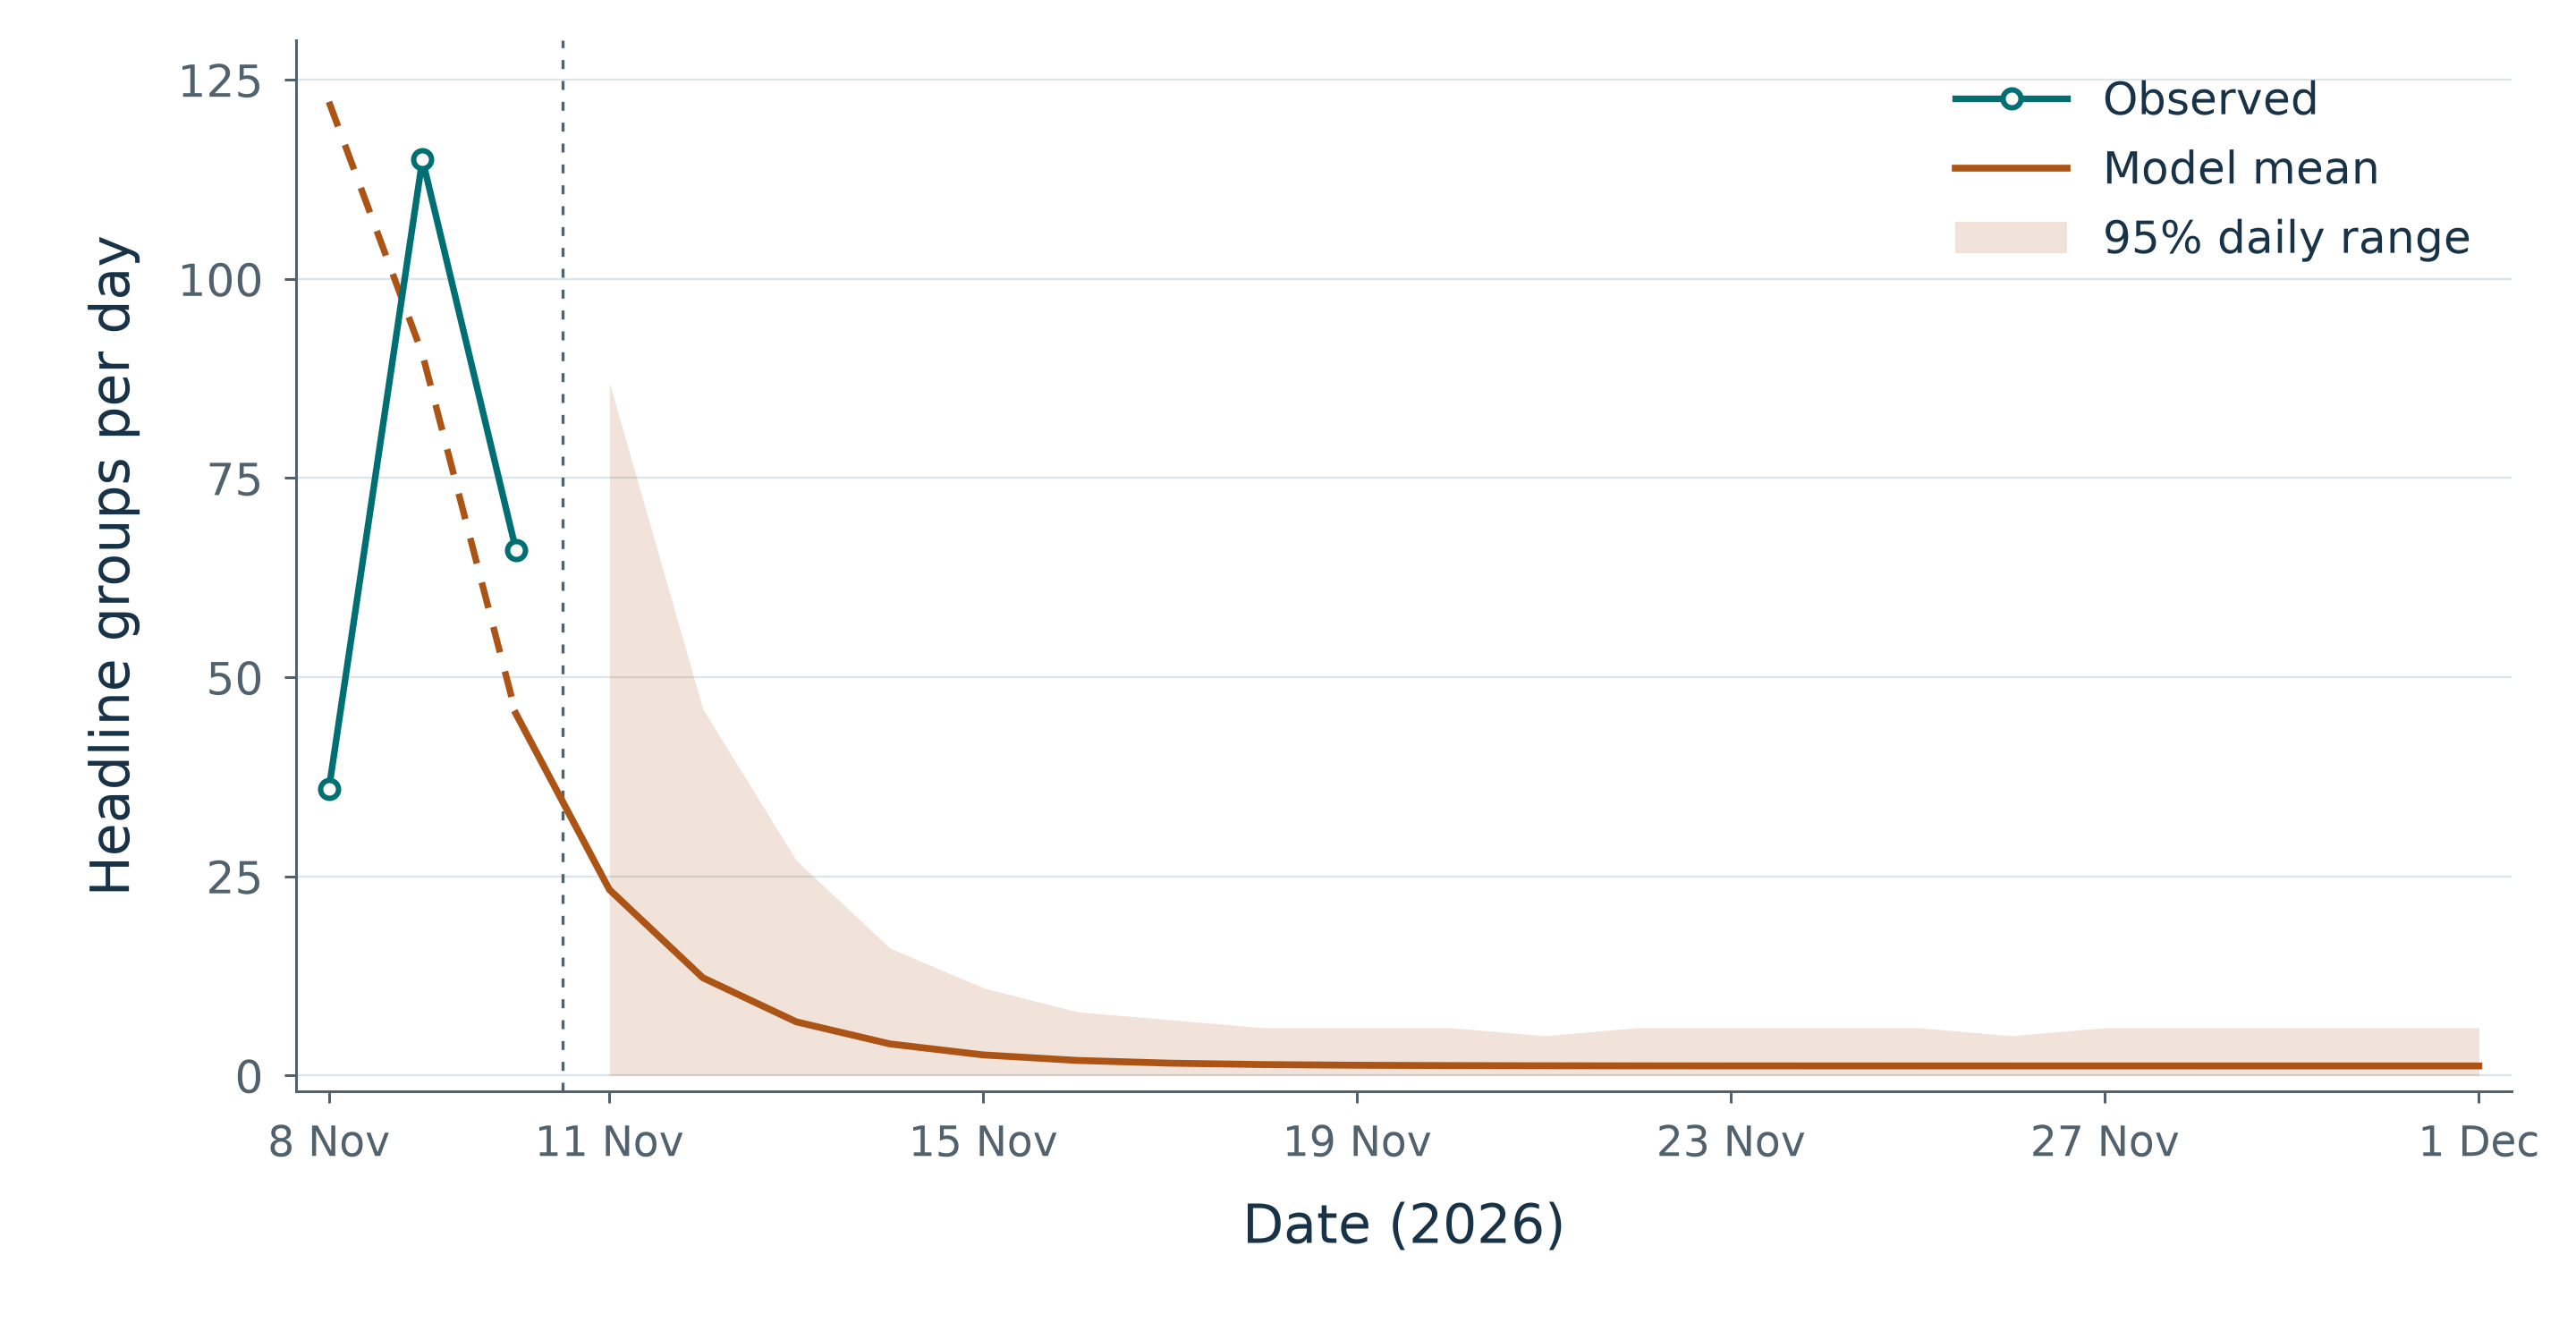
We fitted using the first three days of coverage and calculated from the preceding 28 days. Using the reference-case settings , and , we then generated 10,000 possible coverage patterns for 11 November–1 December, the 21 days following our last completed observation.
The fitted values were and . For future dates, we assumed Media Cloud’s United States National collection would capture its usual 9,382 English-language articles per day, and that no additional major news bursts occurred.
Under these assumptions, the model predicts a rapid decline: approximately 23 headline groups on 11 November, 12 on 12 November and seven on 13 November, approaching one or two groups per day during the following week. Across all 21 days, the expected total is approximately 69 headline groups. The middle 95% of simulated totals ranged from 29 to 141.
Final Remark
Although the event is still brewing, converge consistent with the simulations would support this model's explanation of the pattern, and only sustained excess would justify further investigation. However, if foul play is present, they will definitely know more than what I researched in a few days, hence the result of this research will not give a valid conclusion if such thing exists.
Furthermore, from experience alone, the decline in the stock price might be more closely correlated to suspicion that Nvidia will continue losing the Chinese market as US regulations continues to tighten, and this was just a catalyst to the inevitable results of the midterm election.
Disclaimer: This article reflects my personal opinions and does not constitute investment advice, nor is reflective of the publication's views. I have received no compensation for expressing these views, this is simply an opinion, and I have every possibility of being wrong.
Peter Wan is a writer at the Consilium and a first-year PhD student at the University of Edinburgh. He writes mostly on finance and investing.