
Background
Just a year ago, Canadian oil stocks were a value trade that nobody was rushing into, with Brent at around US$62 per barrel. However, the S&P/TSX Capped Energy Index has enjoyed a ~71% increase over the last twelve months compared to a 20% gain for the entire TSX. The heavy hitters have done even better: Suncor has roughly doubled over the last twelve months, and Canadian Natural Resources (CNQ) has gained ~80%.
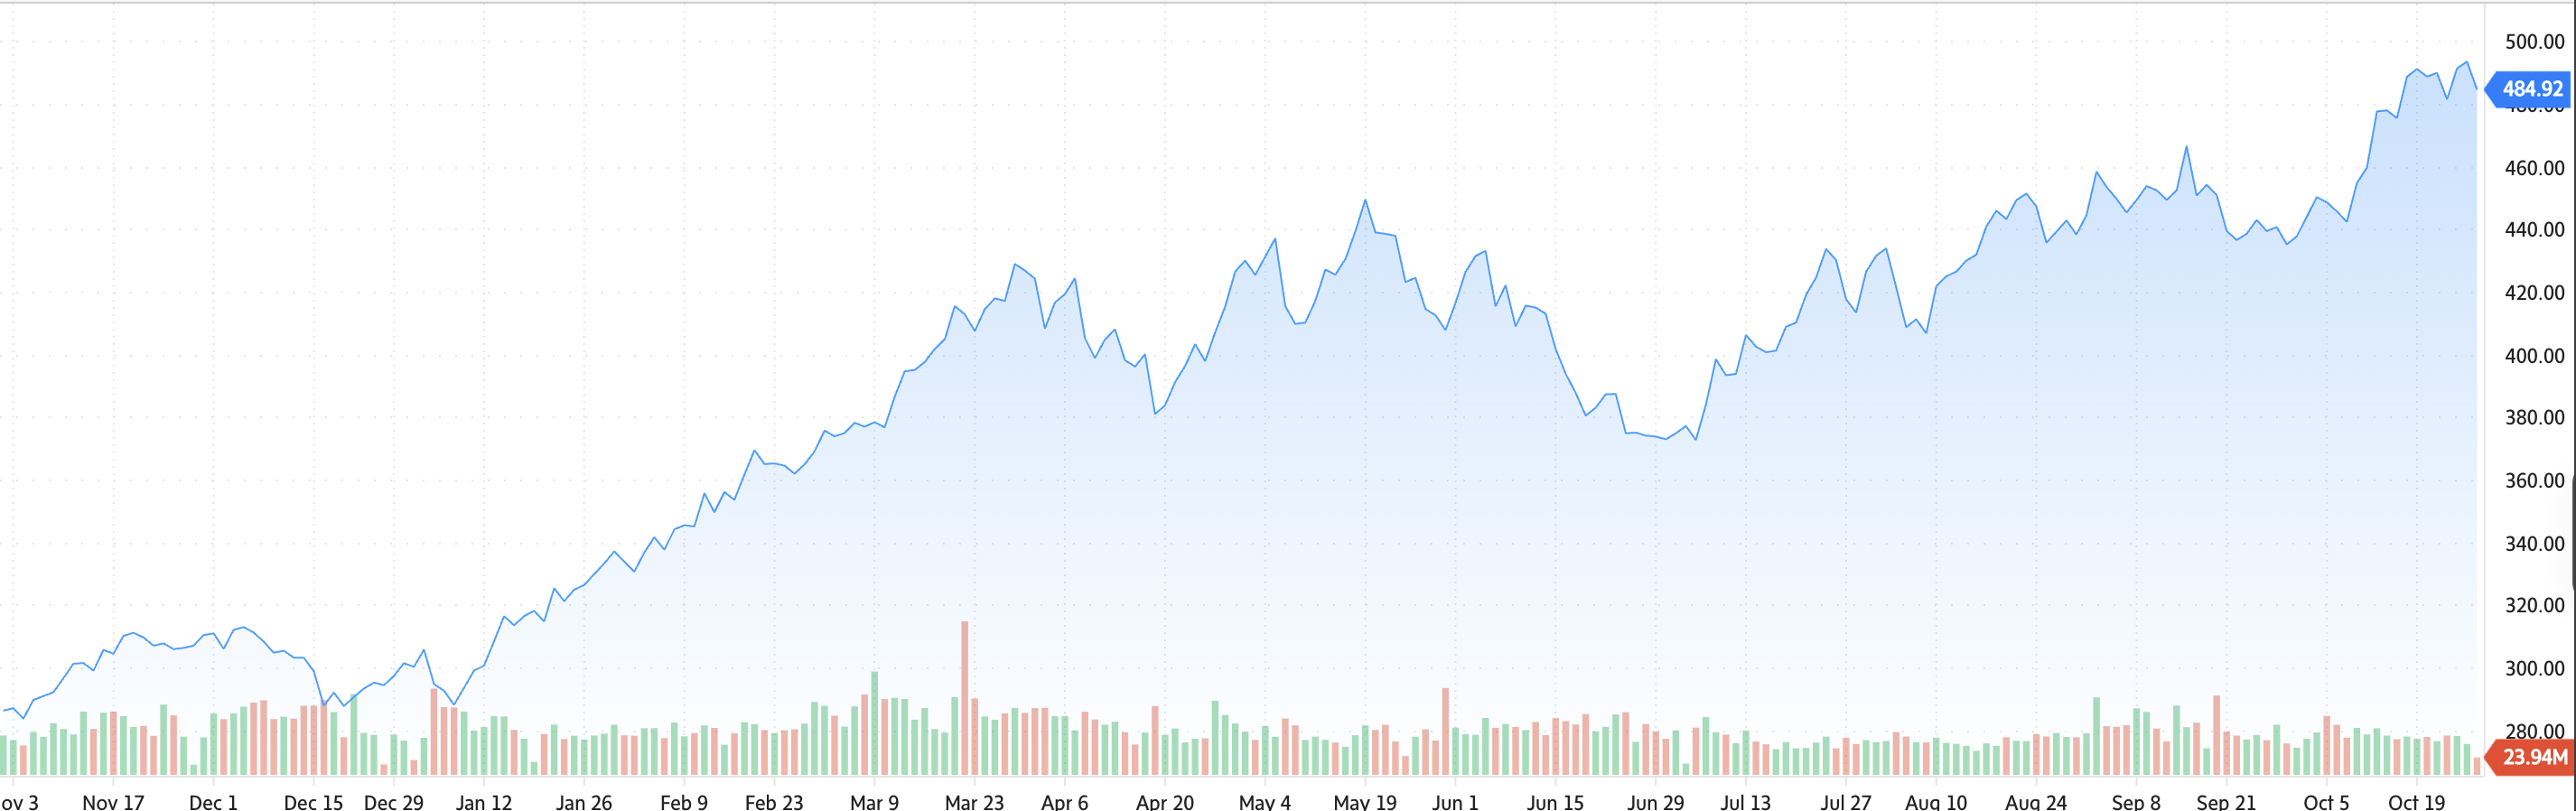
Source: The Globe and Mail
The obvious reason for this is the war in the Gulf. On 28th February, US strikes on Iran caused a major disruption to most tankers passing through the Strait of Hormuz (~1/5th of global oil supply). This caused Brent to rise back above US$100 per barrel within two weeks. Less obvious, however, is that the index had already risen ~23% this year by the last close before these strikes, compared to the TSX rising only 8%.
The rally has come in two phases. The first phase ended when a ceasefire in April and a memorandum of understanding in June caused Brent to dip below US$80. The second started when that accord expired in August, and attacks on shipping resumed; on 20th October Brent touched US$111.99.
Pre-War Rally
Over a third of this year's gain came before a single strike had been made. Some of this was due to the war being priced in early. Brent rose from around US$61 to US$71 in January, and by mid-February the market was openly pricing in the risk of a US and Iran war. The remainder of the rally was due to rotation out of expensive technology stocks into heavy-asset sectors such as Energy, Mining and Utilities. This means the rally has drivers beyond Hormuz. However, this part of the rally was largely a re-rating: investors agreed to pay more for the same cash flows. But this only occurs once. As will be shown in the valuation section, this has largely been completed.
We could give two main reasons for the hype behind Canadian oil giants besides the war: the quantitative easing of the central bank and strong fundamentals of the companies. However, as it will be mentioned later on, Bank of Canada is changing its behaviour which eliminates the half of this hype.
Oil Has Returned, Why Hasn't the Price Dropped?
Despite the return of the barrels, the price has not dropped. Kpler data showed crude oil exports through the Strait of Hormuz had reached pre-war levels of ~13.5 million barrels per day by late September. Non-Iranian Middle Eastern exports had surpassed pre-war levels in the week ending 18th October. Two days later Brent hit its five-month high.
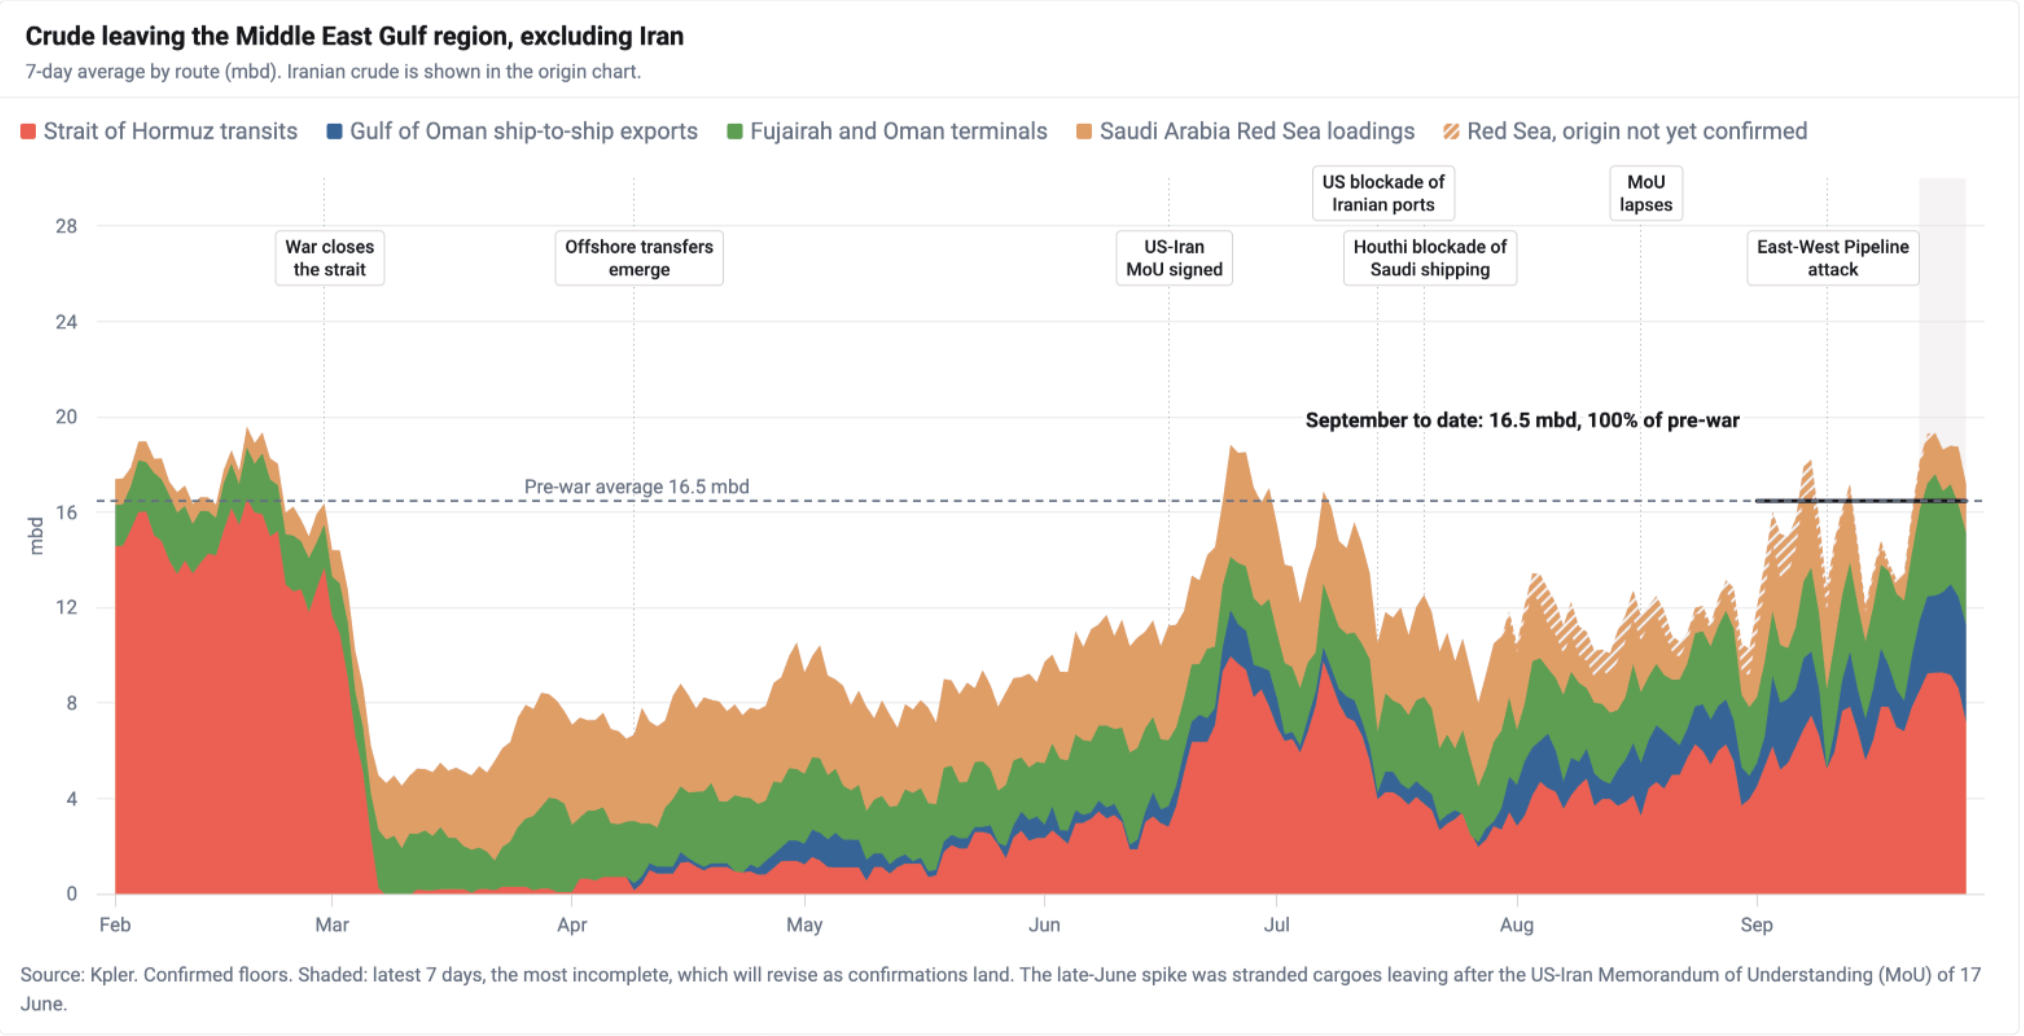
Source: Kpler
There are three reasons why the price has not dropped. Firstly, global inventories are 509 million barrels below pre-war levels, meaning the return of supply is being absorbed into restocking. Secondly, refined product shipments through the strait are still below 1/5th of normal levels. Lastly, tanker attacks hit a wartime weekly high in early October. The market is no longer pricing in the lack of barrels but is looking at the restocking and the risk factor. Goldman Sachs expects both to fade, forecasting Brent at US$85 by year-end and US$80 in 2027.
Why Canada's Tar Sands?
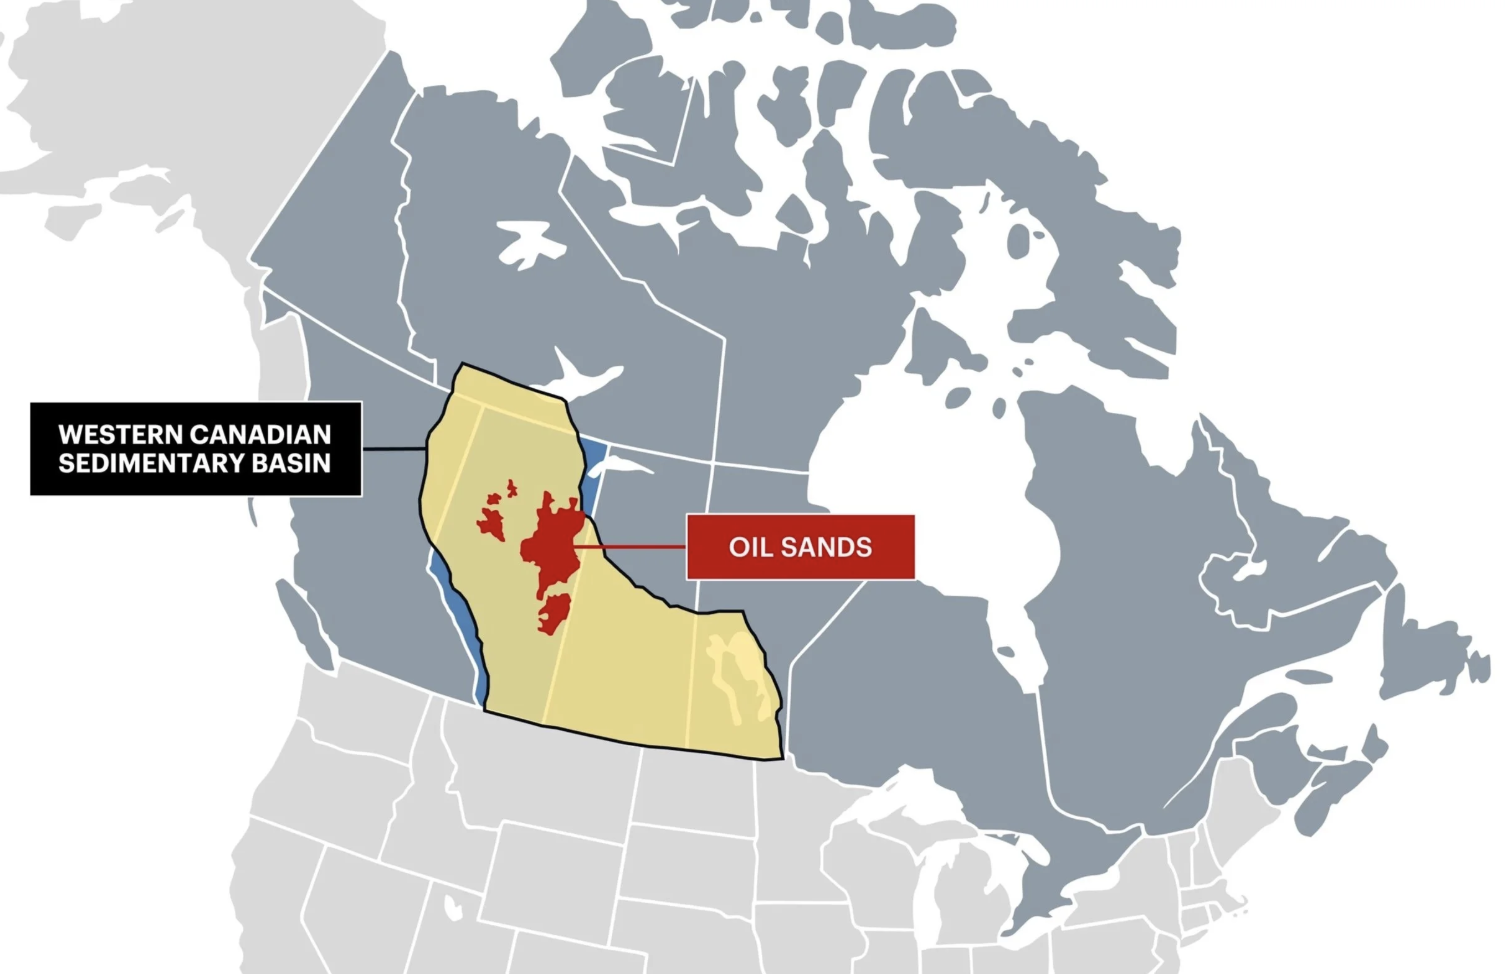
Oil varies greatly in quality. There are many different varieties of crude oil ranging from light low sulphur oils such as US shale oil to heavy high sulphur 'sour' oils. Many of the Gulf's exports are medium or heavy sour crudes. When these oils became unreliable, refiners in Asia and on the US Gulf Coast needed a substitute. Canada is one of the few places that can supply this at scale. In 2025, it produced a record 5.35 million barrels per day. The oil sands (or tar sands as they are known by critics) are expected to produce a record 3.5 million barrels per day in 2026.
The tar sands require billions to set up but then produce for decades with very little decline in output. CNQ has a break-even point, including its dividend, of just over US$40 a barrel, so at today's prices almost every extra dollar is profit. The Trans Mountain pipeline reached full capacity in June, and about two-thirds of the tankers loading at its Vancouver terminal sail for Asia. The catch is the discount: Western Canadian Select trades about US$28 below WTI (around US$15 wider than last year) as pipelines are full and heavy crude oil from Venezuela is returning to the US Gulf Coast.
Source: Oil Sands Magazine
Credit: Oil Sands Magazine
The Loonie: Winners and Losers
When buying Canadian oil stocks from abroad, an investor is making two bets: one on the company and one on the Canadian dollar. This year has not been favourable for foreign investors, as US yields at 24-year highs have pulled money towards the US dollar. This has caused the Loonie to fall from around C$1.37 per US dollar in January to about C$1.40. A US investor in the energy index will have gained ~59% this year, not 63%.
This has, however, been favourable to the companies. They sell oil in US dollars, but most of their costs are in Canadian dollars. For producers, this company-side effect usually has a bigger impact on the share price than the currency loss. Using CNQ's US$40 breakeven as a rough guide to costs fixed in Canadian dollars, a 2% fall in the Loonie lifts the margin on a US$98 barrel by around 3.4% in Canadian dollars. This outweighs the 2% a foreign holder loses on conversion.
However, the interest rate decisions of the central bank is a double-edged sword. Higher rates raise the cost of capital, and the oil business is capital-intensive and fixed-cost-heavy; even a slight jump can substantially affect its valuation.
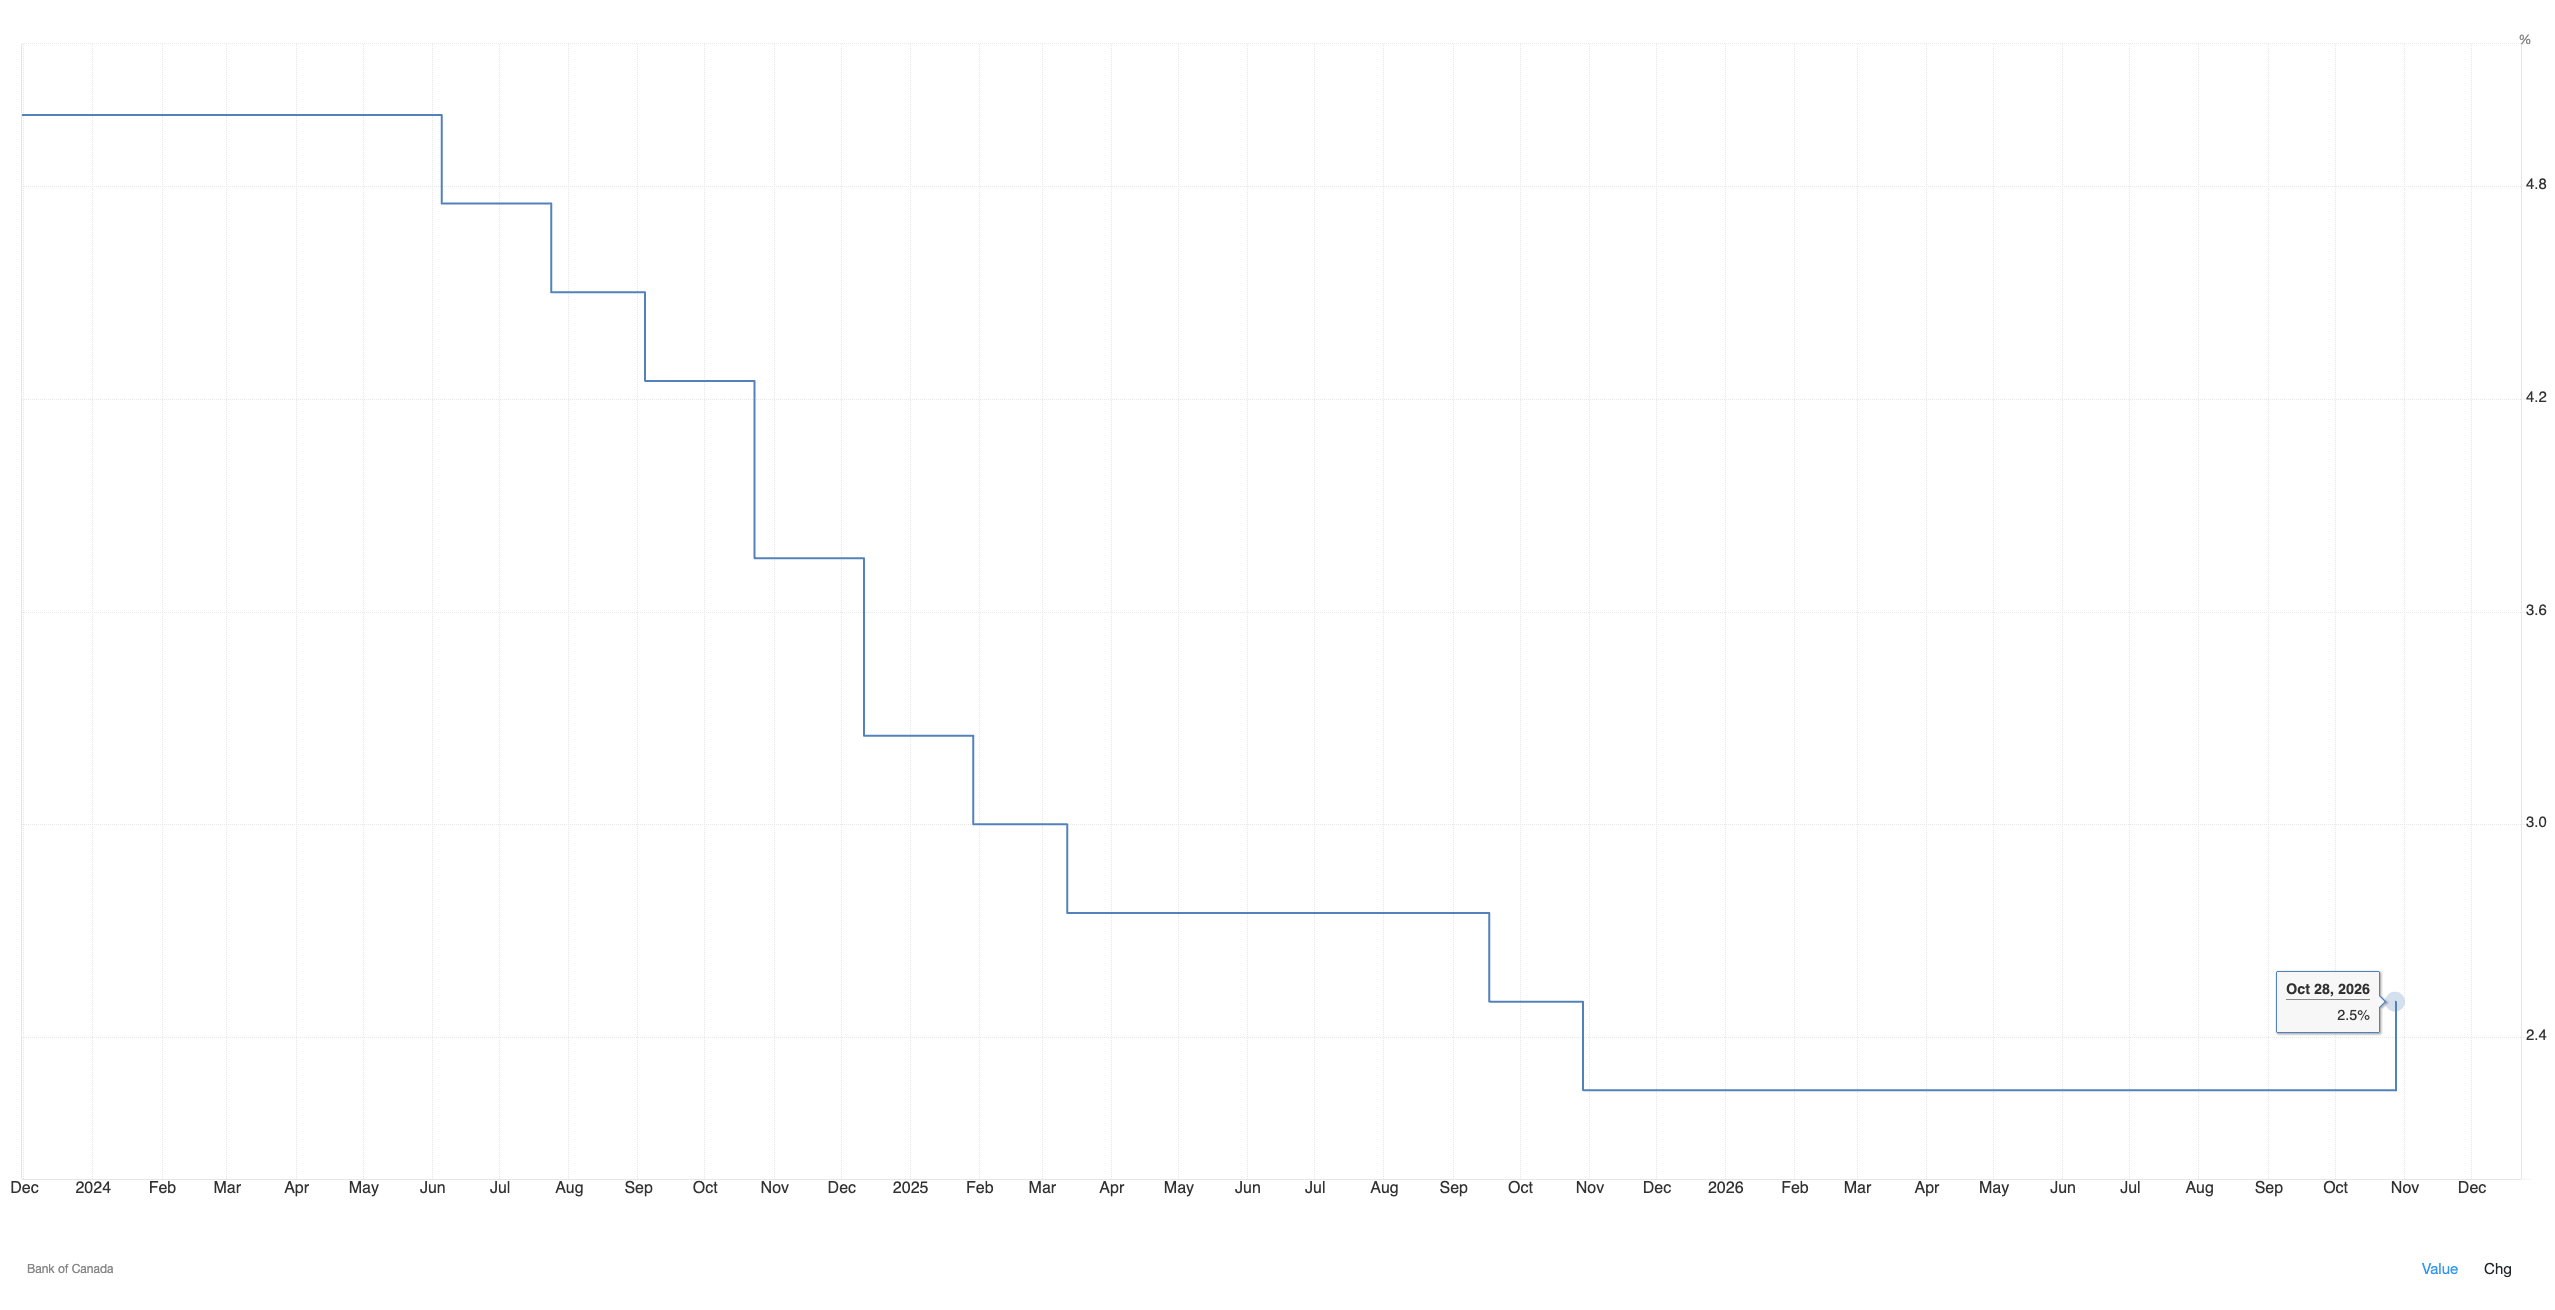
This matters because most of these companies are foreign-owned. A report by Canadians for Tax Fairness estimated the Big 4 were 73% foreign-owned and 60% American owned at the end of 2024. ExxonMobil owns around 70% of Imperial. The weaker Loonie will not cause a negative impact on the Canadian share price, as producers will see their earnings increase in Canadian dollars. For the foreign majority of owners, this largely offsets the loss on conversion. After a long period of holding interest rates at 2.25%, the Bank of Canada has decided to raise its rates to 2.5% by 25 basis points on October 28, 2026. The central bank has made its first rate hike since 2023, in order to get on the way of oil shocks. As seen in 2023, this pivotal move can be interpreted as an alarm for the economy, as Canada has been dealing with inflation in energy prices, which will have its effects on its companies.
Source: Trading Economics
Rotation
Investors’ cash is limited, so when money flows into one sector, it usually comes out of another. This is called sector rotation, and it matters because prices follow flows. LSEG Lipper’s weekly fund flow data shows where that money is going.
Technology had its moment, and money has been rotating out of expensive tech stocks since early this year; tech funds lost US$4.75 billion in the week to 14th October alone. Meanwhile, US healthcare stocks hit record highs on 20th October. Energy funds lost US$216 million that week, but after taking in US$269 million the week before, so over two weeks energy is roughly flat. That could be profit-taking after a 71% run, or just a pause.
Energy also faces competition. Rising yields have pushed bond prices down, but new buyers now get over 5% on a 10-year US Treasury, more than any large oil sands producer’s dividend, and global bond funds took in US$7.8 billion. Other oil regions compete too, with YPF posting record quarterly EBITDA of US$2.8 billion in Argentina and Chevron planning to double production in Venezuela. On the other hand, money is not leaving stocks: global equity funds took in around US$20 billion that week while money market funds lost US$46.7 billion. So the flows cut both ways. Energy has not been abandoned, but it is no longer the obvious place for new money.
Fair Value?
Analysts' numbers show the large names are close to fully valued. Imperial Oil has an average 12-month target price 13% below the current share price. CNQ is -1%, and Suncor is +4%. The only major with meaningful upside is Cenovus, at ~10%. Smaller producers such as Strathcona, Tamarack Valley, Vermilion and Baytex have upside of between 13-19%.
The market is also paying more per dollar of profit than last time. Analysts expect earnings to fall around 17% in 2027 at Suncor and Cenovus, so 2026 is being seen as a peak. In October 2022, with oil around US$88, fund manager Eric Nuttall said Canadian oil companies "are trading near their lowest valuations in [recent] history". The four majors were trading at 6-7.5x 2022 earnings according to StockAnalysis. Now they are trading at 9-12x expected 2026 earnings. Either the market thinks this cycle will last longer than analysts expect or the majors are overvalued. Note that target prices lag share prices, so they will increase if Brent remains above US$100.
End of the Party?
Not yet, but it is close. The oil price is now based on restocking and risk factors, and these will naturally fall. Analysts expect earnings to fall in 2027. Three of the four majors have little/no upside left, and investors are paying more per dollar of their earnings than in 2022. The Loonie may also be about to strengthen. Lastly, Canadian heavy crude is losing out to Venezuela's.
However, there is some bullishness. Governments have drawn down emergency stocks as part of a plan to release ~400 million barrels. These will eventually need to be replenished. There could also be renewed tension after the 3rd November US midterms, as Washington has said they will not strike Iran before then. If there is renewed tension, the premium could return. If there is a second wind, it is more likely to be seen in the mid caps. For the large caps, the asymmetry has flipped. To make further gains, the risk premium needs to last longer than the futures curve prices in. To lose money, it just needs to fall as expected.
Kerem Baskir is a writer at the Consilium and a second-year Economics with Finance student. He writes on global financial markets and equities.